Before beginning this tutorial, you should have sensors you are interested in connected to your microcontroller already (see previous Temperature, Light, Distance, or Multisensor build pages)
2. Disconnect the battery before adding to your sensor circuit if you adding on to a previous PublicSensors sensor build. *NOTE: Never adjust your circuits while it is powered!*
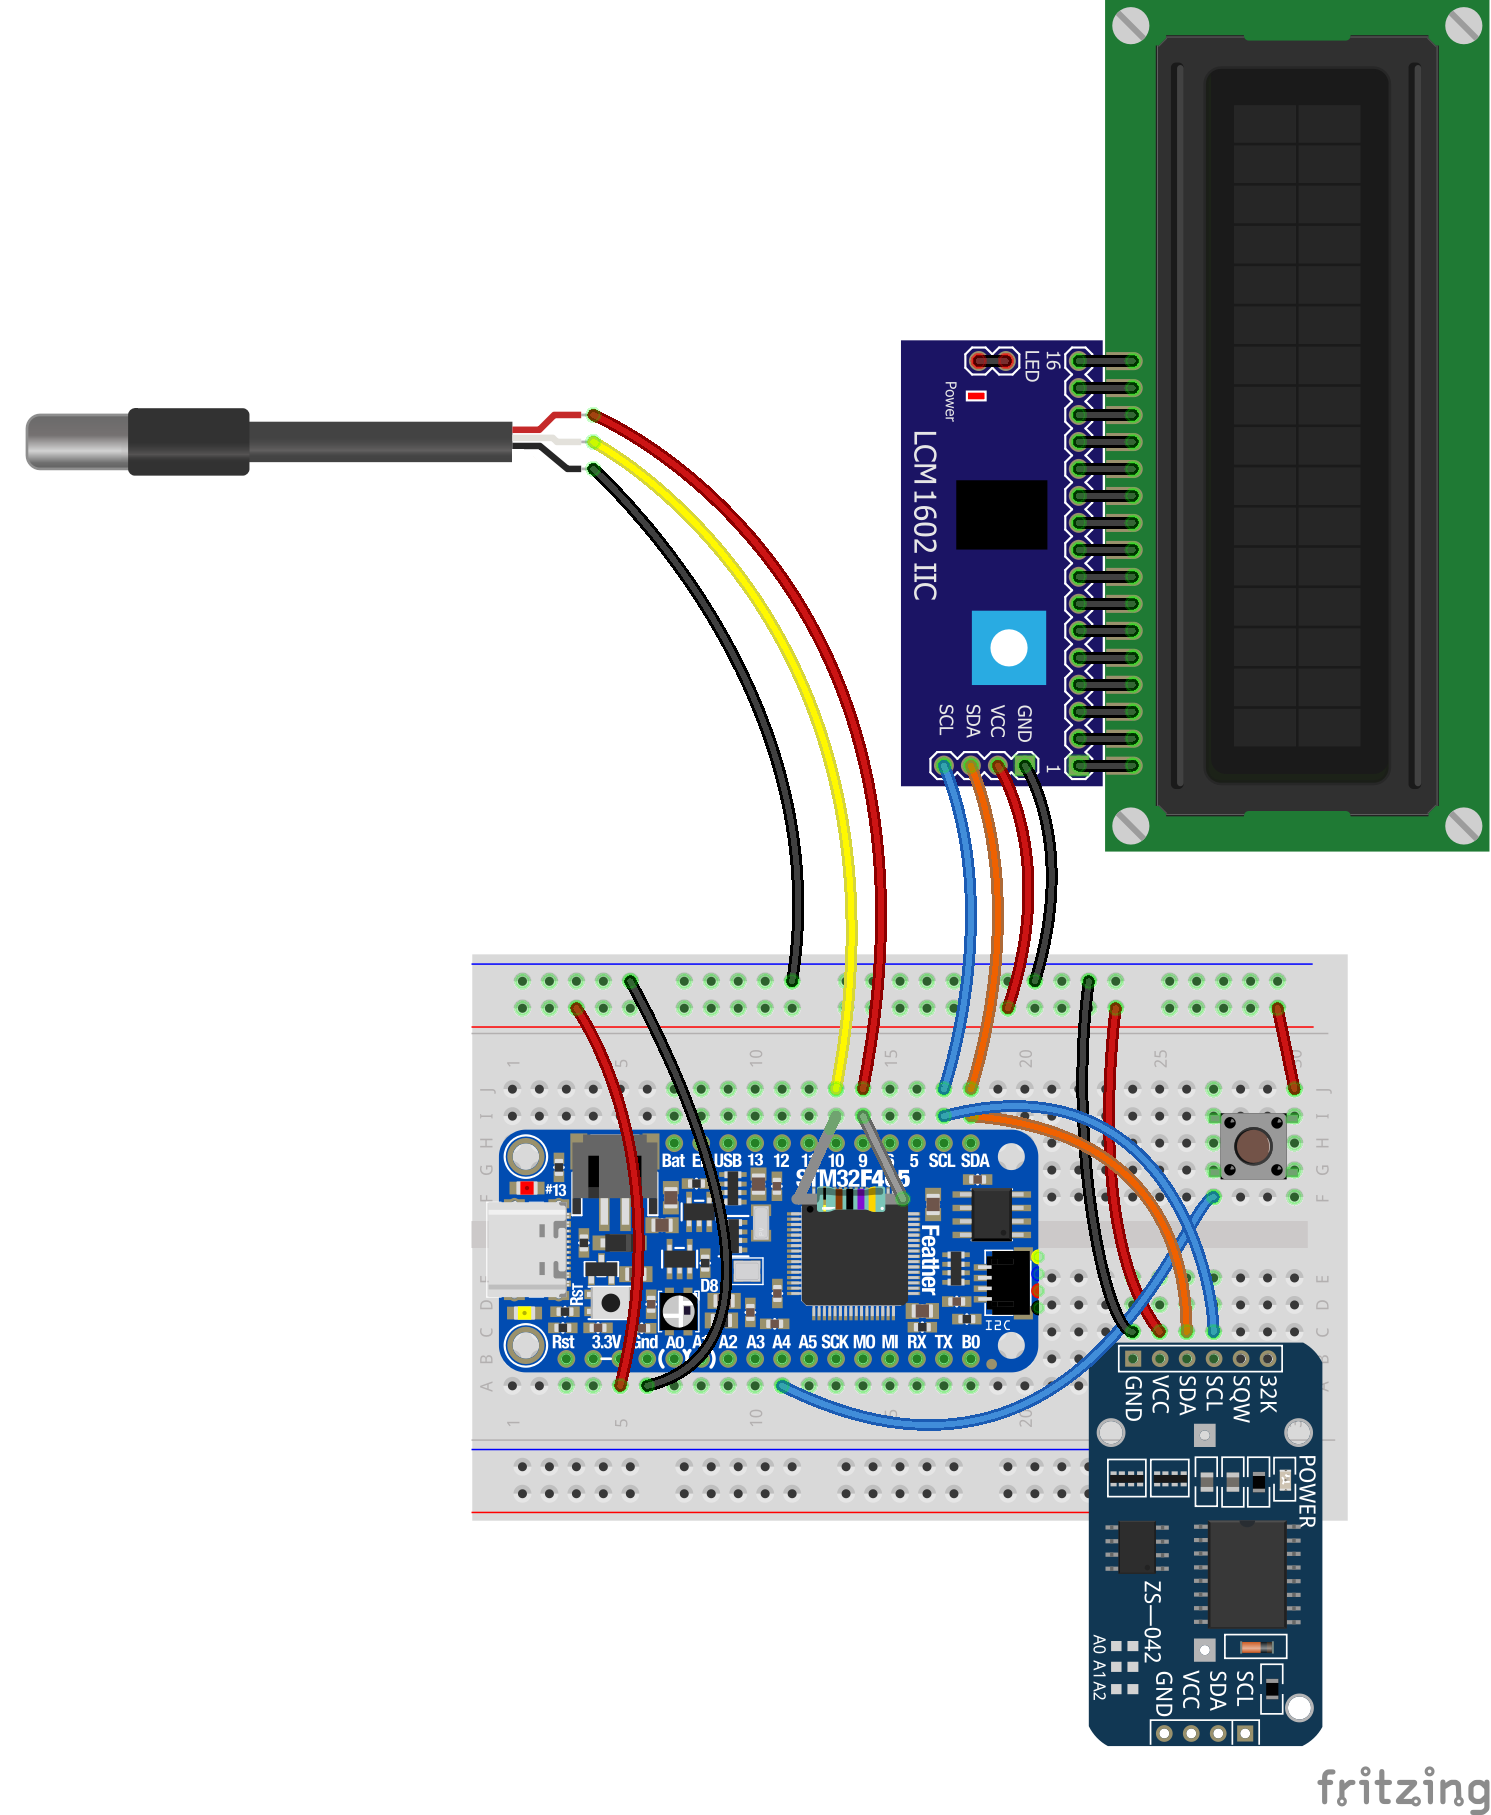
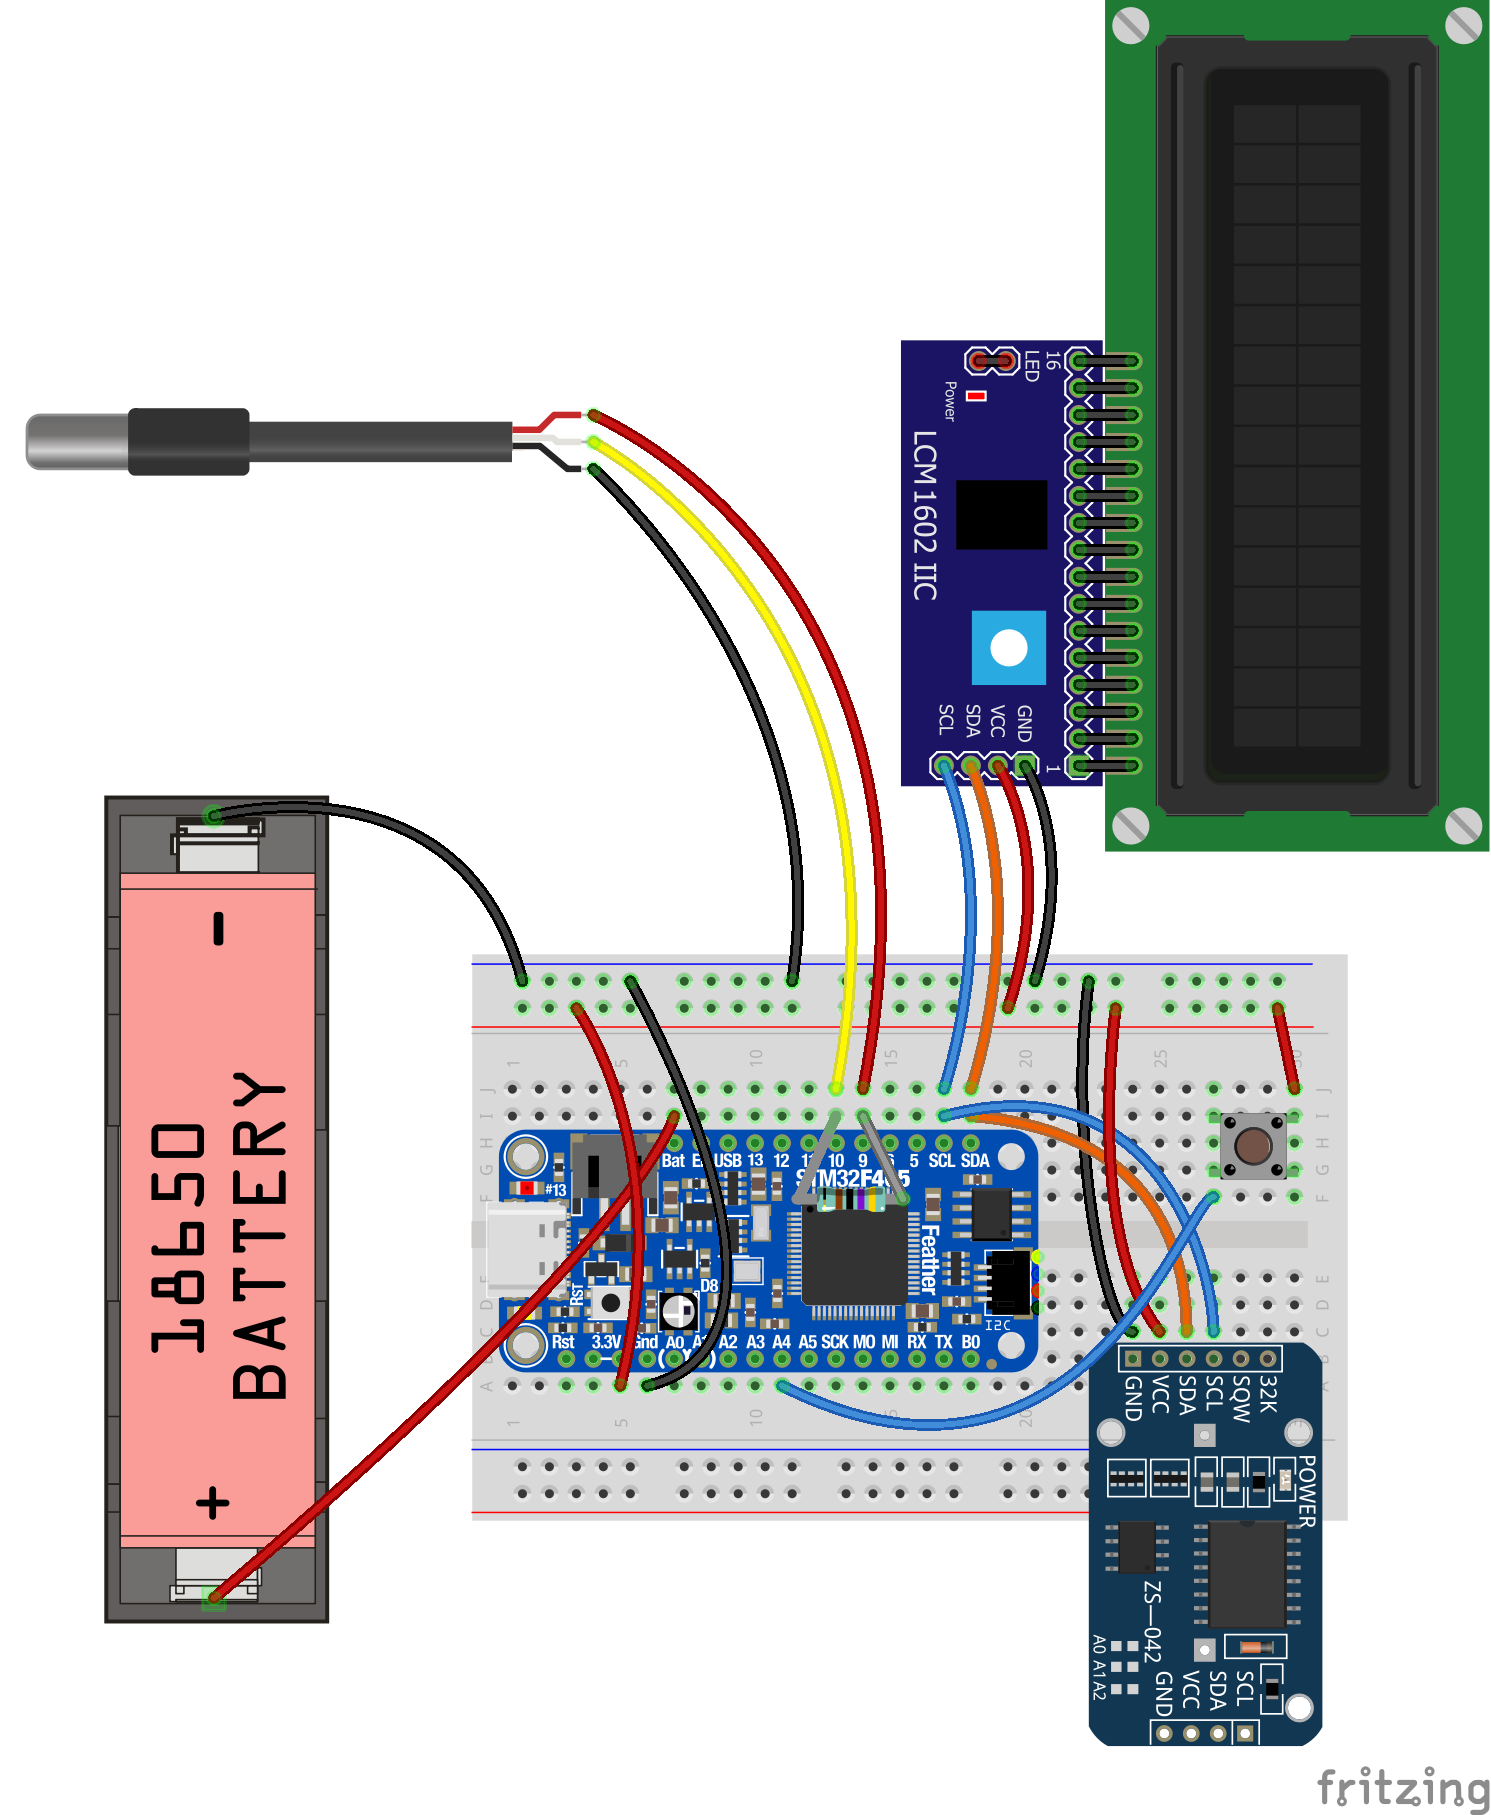
3. Connect the clock to your sensor as shown in Figure 6.2:
Connect VCC on the clock to the (+) rail on the breadboard
Connect GND on the clock to the (-) rail on the breadboard
Connect SCL on the clock to SCL on the breadboard
Connect SDA on the clock to SDA on the breadboard.
Figure 6.2
Program your Data Logger:
A key feature of your data logger is that it takes data measurements without you pressing a button. This automation is controlled by computer scripts that are saved on your microcontroller. You can modify these scripts to tell your data logger how frequently to take samples and how you want your data to be saved. Below we walk you through how to access and modify the scripts on your microcontroller so you are able to program your data logger to operate the way that works best for your specific environmental questions.
To edit the settings for logging data:
Remove the microSD card from the microcontroller and insert it into your computer using the microSD card reader
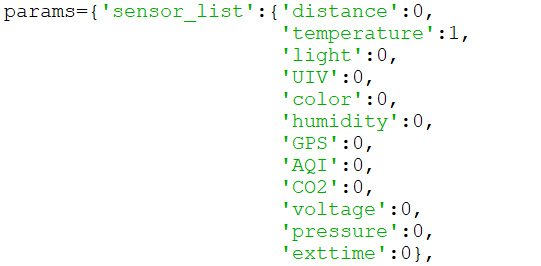
Open the SetUp folder and find the user_params.py file
Open the user_params.py file. You can open this with a text reader.
For each sensor add a 1 next to the variable. In the example below, temperature is marked with a 1 because that is the only sensor connected in the example in circuit diagram below.
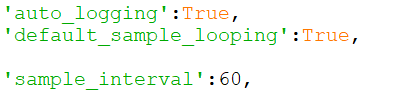
Lower down in the same file, edit the parameters to control how often you want to take samples and how you want your data displayed and saved
Set auto_logging to True as shown below to record data to a file.
Set default_sample_logging to True as shown below to start data sampling automatically when the sensor gets battery power.
Set sample_interval to the number of seconds you would like between each sample. The example below is set to 60 seconds between samples
Constructing your data logger is very similar to constructing your multisensor, except you need to add a real time clock to your breadboard to log the time your data measurements were sampled. Depending on what sensors you chose to include in your data logger, you may need to move some jumper wires around to make room for the clock. Use the diagrams below to modify your breadboard accordingly.
The example below shows how to add the clock the the temperature sensor circuit
Set the Clock on your Data Logger:
After you have set up your data logger, it is important to check that the external clock is set to the correct time:
Connect your microcontroller to your computer using the USB cable.
Open the Beagle Term Chrome App (for additional instructions on setting up Beagle Term, see ‘Connect to a Microcontroller’)
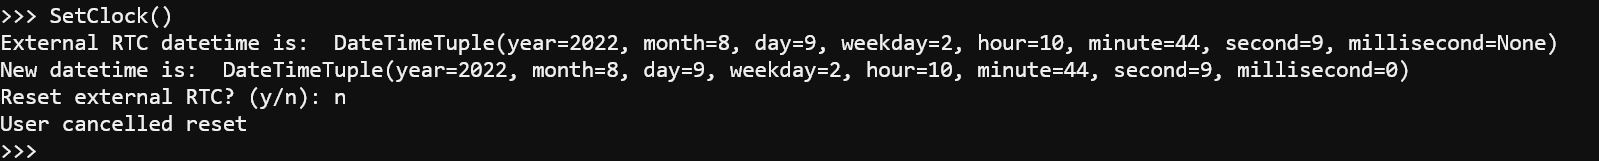
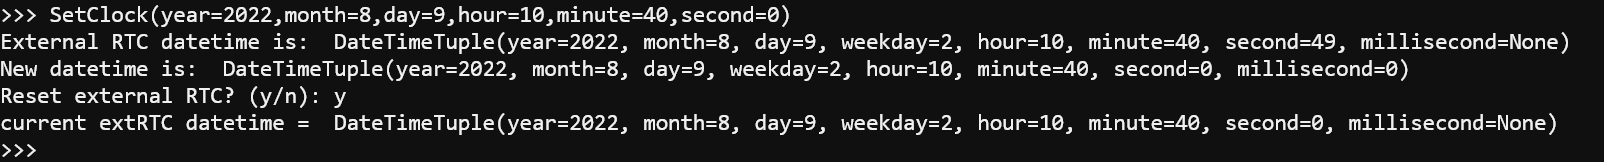
To check the time on your external clock type “SetClock()” and hit enter.
The current time on your external clock will be printed to the screen as shown below. If the time is correct and you don’t need to update the time type “n” after the “Reset external RTC?” prompt.
4. If the time was incorrect and you want to reset the external clock, use the SetClock() command again and set the time variables you want (an example is shown below) and then hit enter. It’s a good idea to write the time a couple seconds ahead of the current time so you can hit enter at the exact time.
5. After you hit enter, the updated time will be shown on your screen (see below). To confirm that you would like to reset the clock to the updated time type “y” after the “Reset external RTC?” prompt and hit enter.
6. The updated time will be printed to your screen (as shown below). You have now successfully updated your external clock and your logger is ready to go into the field!
Collect and Retrieve Data:
Once your data logger is built and the time is correct you can setup your logger to collect data:
If you connected to the computer to set the clock, unplug USB cable from your microcontroller. *Make sure to eject the microcontroller properly!*
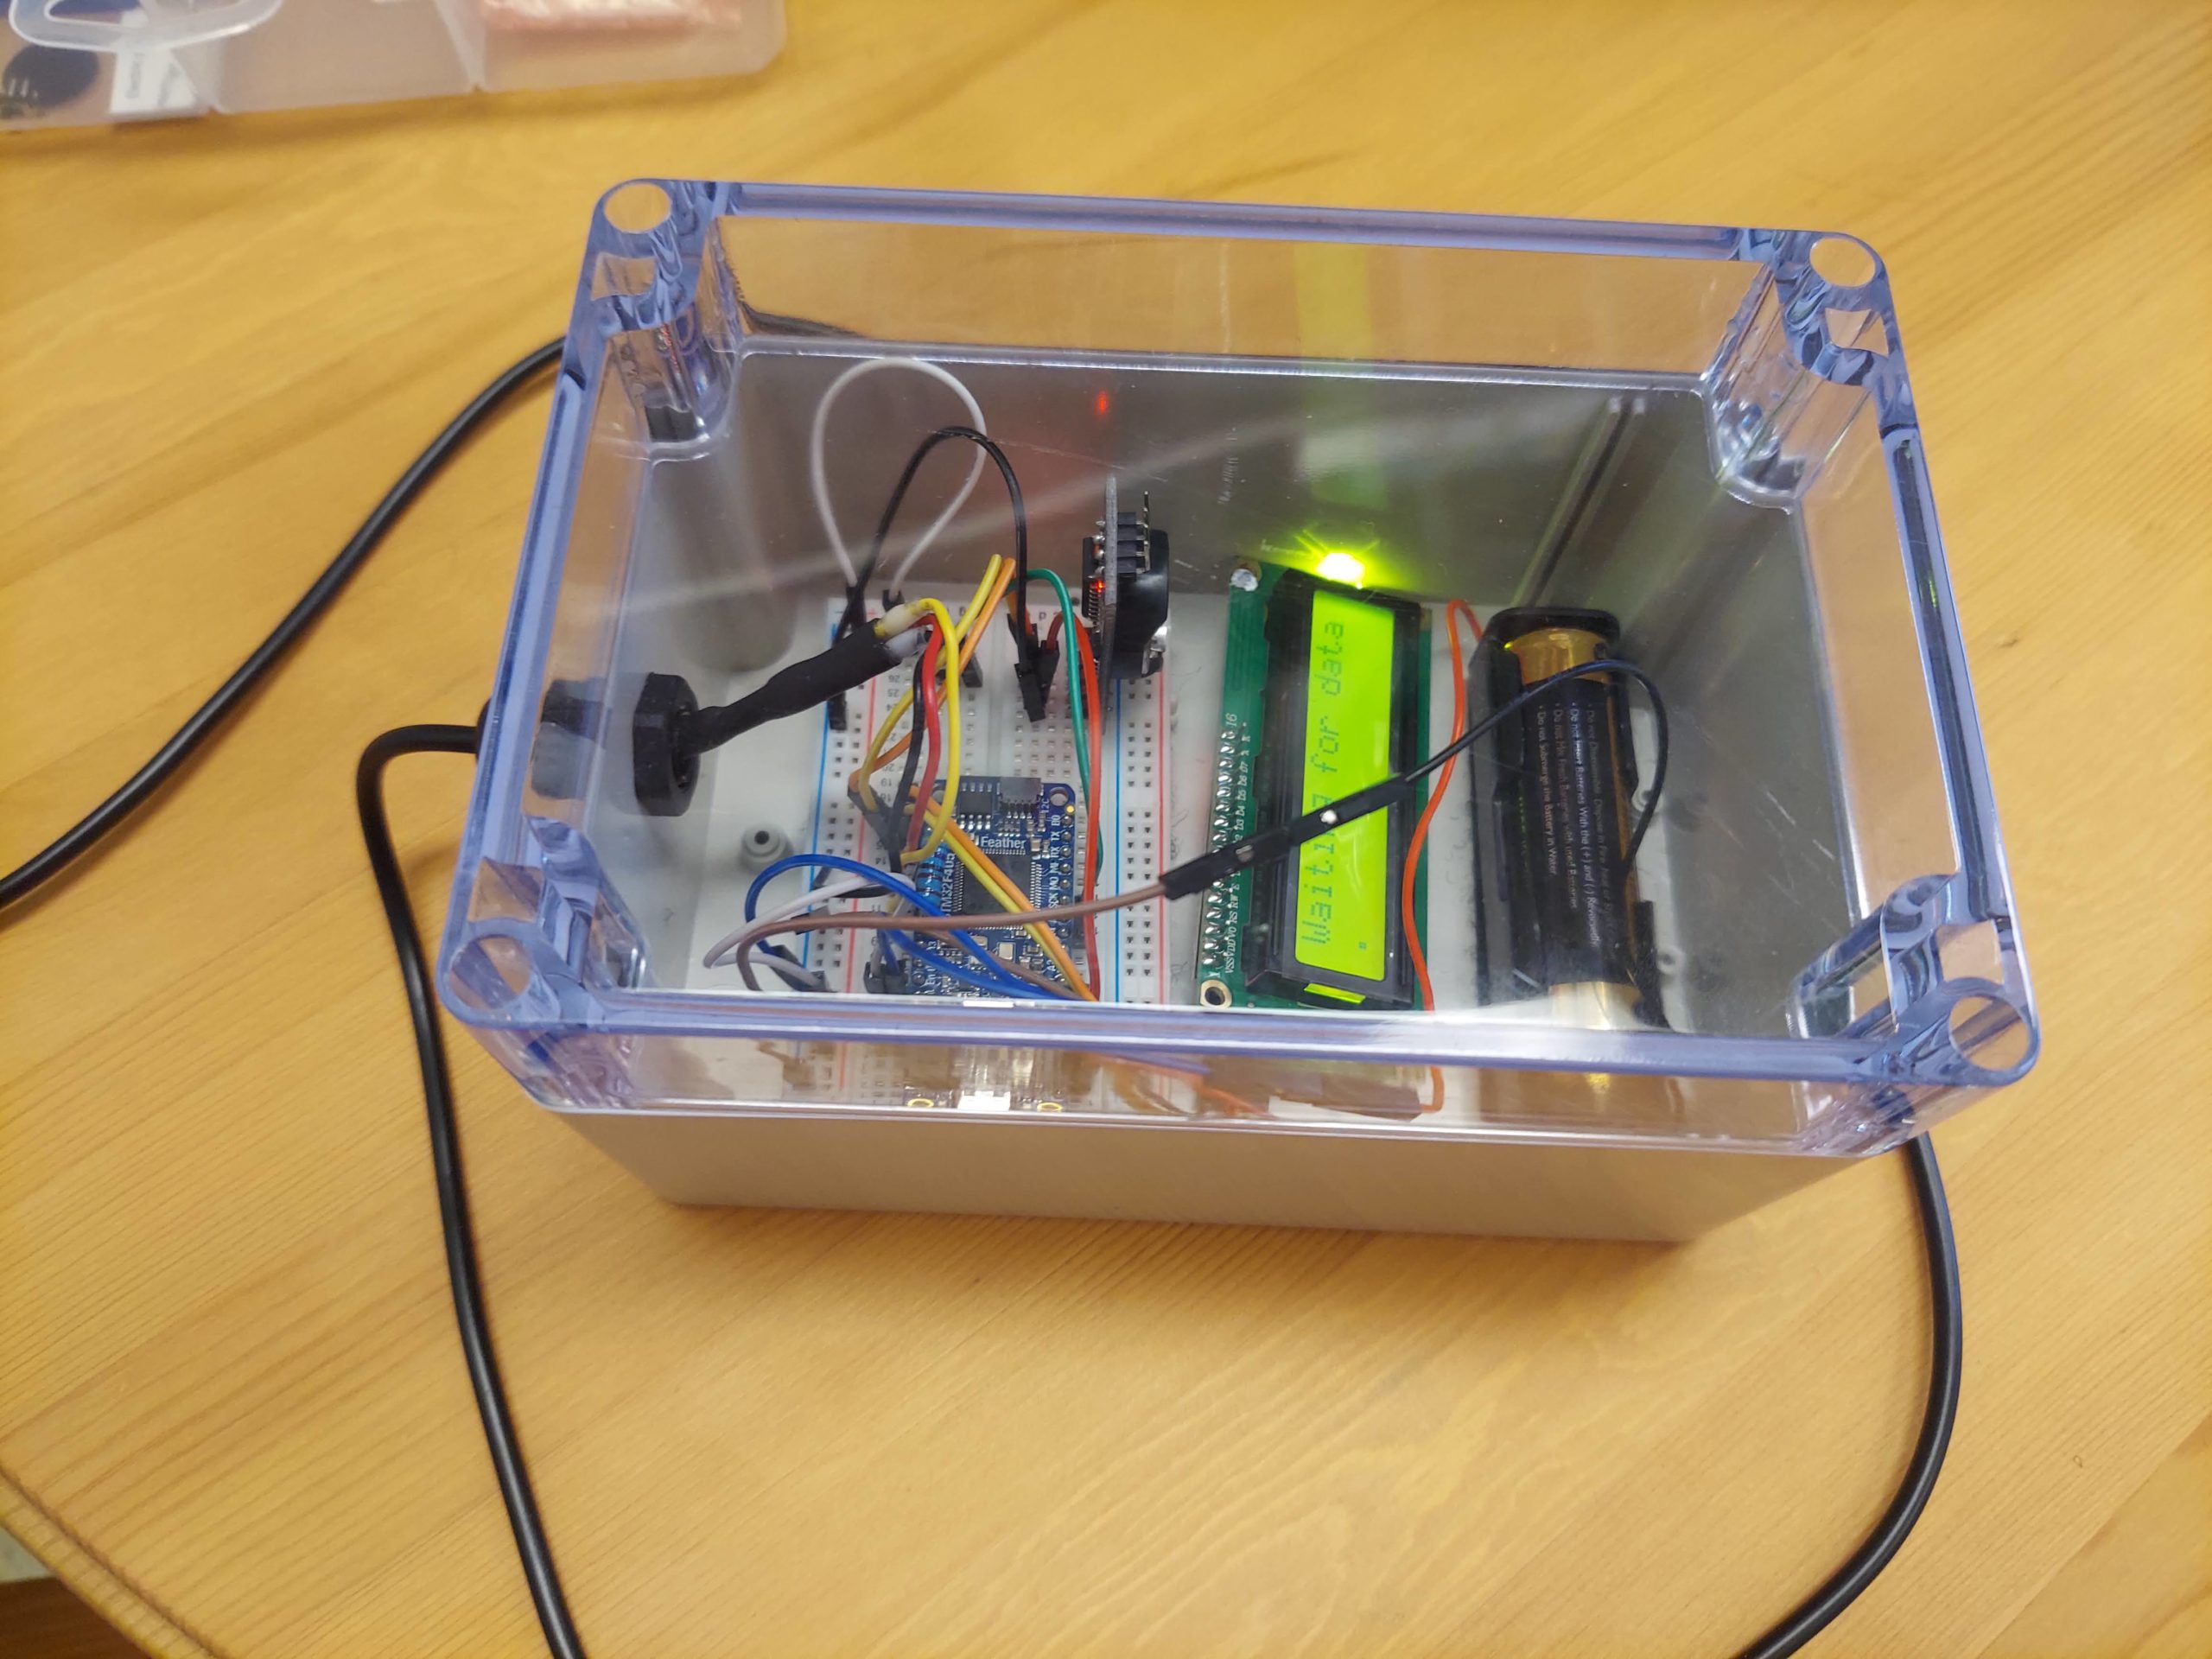
2. Reconnect the battery to power the sensor as shown in Figure 6.3. Your LCD should light up like in previous exercises.
3. Between data collection intervals, the LCD should read “Waiting for data…“
Figure 6.3
After you have sampled for a period of time, you’ll want to look at the data file you recorded:
Disconnect the the battery wires from breadboard to remove power from the sensor.
2. Remove the microSD card from the microcontroller and insert it into your computer using the card reader provided in your kit.
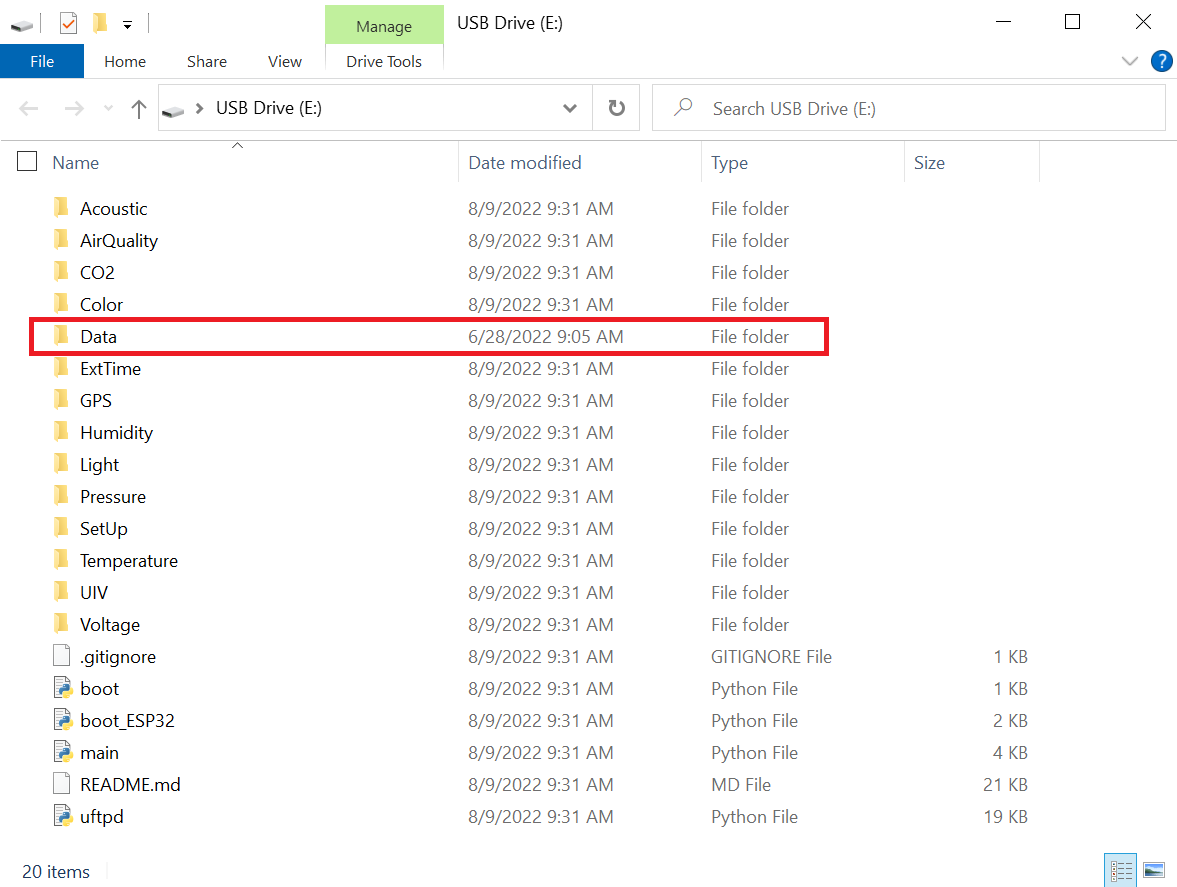
3. Open the Data folder on the microSD card to view your data files
Figure 6.4
You should have a data file for each sensor you collected data from. The file name should contain the time your started sampling and the sensor type you collected data from.
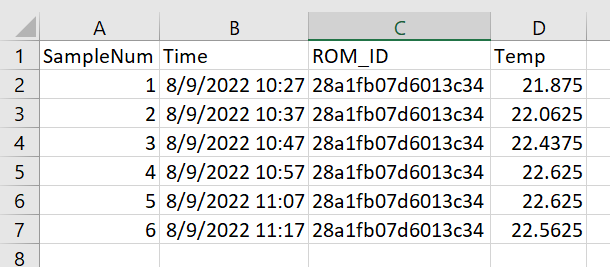
An example data file is shown below in Figure 6.5. The data below was taken from a temperature sensor sampling every 10 minutes. The columns shown the sample number, the time, the ROM_ID (this is useful if you have multiple temperature sensors attached so you can distinguish between them) and the temperature collected (in Celsius).
To look for patterns, you can use this data to create a graph of temperature over time.
Figure 6.5
Weather-proof your Data Logger (optional):
With the circuit above you can automatically log your data over a designated period of time. But, if you want to put your sensor outside to measure environmental temperatures, you’ll need a way to protect the sensitive electronics from dirt, rain, wind in the outdoors. Below you will find instructions to put your logger circuit into a protective box which will be safe for you to leave outside.
Assemble your circuit in a plastic tupperware that will fit your circuit as laid out below. If using a PublicSensor loaned kit, you will be provided with a tupperware. If you are building the tupperware housing yourself, see the Kit Assembly Guide instructions.
Velcro the breadboard
2. Drill holes to thread the wires of the attached sensors through the side of the tupperware. Exercise caution when drilling holes: make sure to secure the tupperware well while drilling and to use the property safety equipment like safety glasses.
3. Open the Data folder on the microSD card to view your data files